Market Swoon Triggered by Recession Fears
by Sequoia Financial Group
by Sequoia Financial Group
Last week started off in dramatic fashion as a perfect storm of weak economic data, resurgent US recession concerns and the reversal of the Japanese “carry trade” resulted in a global sell-off in financial markets.
Fear of a US recession was the main culprit for the global market meltdown after a disappointing July jobs report. Market weakness on Friday turned into a rout on Monday, with the Dow Jones Industrial Average down 2.60%, the NASDAQ Composite losing 3.43%, and the S&P 500 sliding 2.99%. The blue-chip Dow and S&P 500 registered their biggest daily losses since September 2022.1
Investors are also concerned that the Federal Reserve is behind in cutting interest rates to bolster an economic slowdown, with the central bank choosing instead last week to keep rates at the highest in two decades.1 At Monday’s lows, the S&P 500 was down almost 10% from its recent all-time high. The NASDAQ’s pullback reached full-fledged correction territory of beyond 10%.2
Accompanying the sell-off was a spike in volatility. The CBOE Volatility Index (VIX) – Wall Street’s “fear index” – reached a level of 51,3 a height last seen during the onset of the COVID-19 pandemic and the Great Financial Crisis.4 Tuesday saw somewhat of a relief rally, but Wednesday’s rally failed by day’s end. Markets closed higher for the remainder of the week, and by Friday, the resiliency of the financial markets had almost erased Monday’s declines.
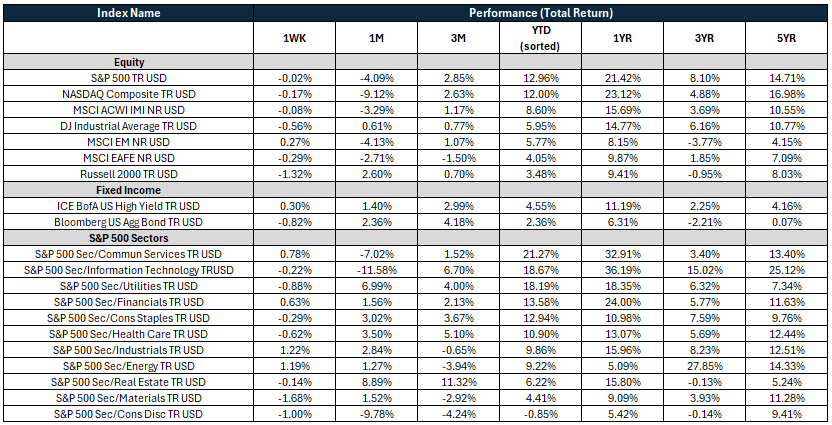
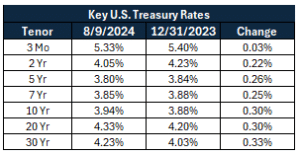
The S&P 500 closed the week down 0.02%, the tech-heavy NASDAQ shed 0.17% while the Dow was the laggard, falling 0.56%.5 Fixed income markets were not immune to the volatility. After closing the previous week at 3.80%, the 10-year US Treasury bond briefly topped 4% on Thursday and settled at 3.94% by Friday as recession fears subsided.6 The Bloomberg US Aggregate Bond Index fell 0.82% on the week7.
Though 2Q corporate earnings took a back seat to other news last week, there were still some noteworthy results. Health care standout Eli Lilly (LLY) reported earnings and revenue that blew past expectations and hiked its full-year revenue outlook by $3 billion as sales of its blockbuster diabetes drug Mounjaro and weight-loss injection Zepbound spiked.8 Diversified industrial leader Parker-Hannifin (PH) rose to a 52-week high on stronger-than-expected fiscal fourth-quarter results. The company also issued stronger-than-expected EPS guidance for the full year.9
For Q2 2024, with 91% of S&P 500 companies now having reported, 78% have reported a positive EPS surprise and 59% have reported a positive revenue surprise. The blended earnings growth rate for the S&P 500 is 10.8% year over year, which, if it remains at this this level, will mark the highest year-over-year earnings growth rate reported by the Index since Q4 2021 (31.4%).10 From a valuation perspective, the S&P 500 Index remains expensive: its forward 12-month P/E ratio is 20.2x, which is above both the 5-year average (19.4x) and the 10-year average (17.9x)10.
Investors will be looking ahead this week for further clues on the strength of the economy, particularly the trend in inflation. July’s Consumer Price Index will be released on Wednesday, and insights into the labor market will be gained with Thursday’s release of Initial Jobless Claims.
Sources:
- https://www.cnbc.com/2024/08/04/stock-market-today-live-updates.html
- https://www.cnbc.com/2024/08/08/stock-market-today-live-updates.html
- https://www.cnbc.com/quotes/VIX?qsearchterm=VIX
- https://www.cnbc.com/2024/08/08/stock-market-today-live-updates.html
- Morningstar Direct
- https://home.treasury.gov/resource-center/data-chart-center/interest-rates/TextView?type=daily_treasury_yield_curve&field_tdr_date_value_month=202408
- Morningstar Direct
- https://www.cnbc.com/2024/08/08/eli-lilly-lly-earnings-q2-2024.html
- https://www.cnbc.com/2024/08/08/stocks-making-the-biggest-moves-midday-lly-uaa-wbd-.html
- https://advantage.factset.com/hubfs/Website/Resources%20Section/Research%20Desk/Earnings%20Insight/EarningsInsight_080924.pdf
The views expressed represent the opinion of Sequoia Financial Group. The views are subject to change and are not intended as a forecast or guarantee of future results. This material is for informational purposes only. It does not constitute investment advice and is not intended as an endorsement of any specific investment. Stated information is derived from proprietary and nonproprietary sources that have not been independently verified for accuracy or completeness. While Sequoia believes the information to be accurate and reliable, we do not claim or have responsibility for its completeness, accuracy, or reliability. Statements of future expectations, estimates, projections, and other forward-looking statements are based on available information and Sequoia’s view as of the time of these statements. Accordingly, such statements are inherently speculative as they are based on assumptions that may involve known and unknown risks and uncertainties. Actual results, performance or events may differ materially from those expressed or implied in such statements. Investing in equity securities involves risks, including the potential loss of principal. While equities may offer the potential for greater long-term growth than most debt securities, they generally have higher volatility. Past performance is not an indication of future results. Investment advisory services offered through Sequoia Financial Advisors, LLC, an SEC Registered Investment Advisor. Registration as an investment advisor does not imply a certain level of skill or training.


Major Equity Indices Decline as Post-Election Euphoria Fades